The Social Rankings app lets you see where your newsroom stacks up in the social media race. But how exactly does it work? We went straight to the source to give you some insight into the inner workings of this fantastic tool for newsrooms. The mastermind behind it all is VP of Product Engineering, Aaron King. King has led the Social News Desk development teams for more than 2 years, and has answers to all of your nerdiest questions… here goes:
DD: There is so much data inside this Social Rankings app. Where does all that data come from and where does it go?
AK: Yes, it really is an insane amount of data. For Social Rankings, we’re tracking more than 1,200 newsrooms and 40,000 posts every day, all of which generate engagement in the millions. Our Social Rankings app provides a top-down ranking of all major media outlets in each of the 210 U.S. markets. The data, of course, is derived from Facebook but the value is created in exposing the competitive key performance indicators (KPIs) and identifying who’s winning and losing.
DD: Right, the “winning and losing” aspect is an interesting thing to consider in the social sphere. TV stations are well-acquainted with it in terms of viewer ratings. But what determines the order or rank within the Social Rankings app?
AK: It’s actually pretty simple. The ranking is based on the percentage share each Facebook page earns of the market’s total engagement on a given day.
So if a given market, say Detroit, has 100,000 likes/comments/shares on a given day and WDIV has 40,000 then WDIV has 40% of the total share. Let’s say Fox 2 follows with 25,000 (25%) and The Detroit Free Press with 15,000 or 15%, and the rest of the engagement goes to other outlets. WDIV will be ranked #1, followed by Fox 2, then by Free Press and then the remaining outlets.
Of course that’s not the end of the story… A page’s daily engagement is largely influenced by the number of fans it has, the volume of posts it makes, and of course the quality of the content. A page with more fans will have an advantage, that’s just basic economics, but any page can steal the #1 spot by frequently posting highly engaging content. It’s great to see the battle taking place in each market!
DD: That’s a good point, let’s talk about those other values being measured in the app along with “Share of Engagement.” Can you give us a overview of the values of “engagement”, “volume” and “per-post engagement”?
AK: “Engagement” is the sum of all the likes, comments and shares (aka simple/basic engagement) generated by all of a page’s posts for a given period. “Volume” is the number of posts sent within a given period. “Per-post engagement” is the total “engagement” divided by the “volume.”
DD: Thank you. We get a lot of questions regarding those values and how the “per-post engagement” is calculated. When do all these data points and rankings update?
AK: Statistics inside the Social Rankings app are updated on an hourly basis. So the “Latest 24 Hours” scoreboard is looking at the 24 hours immediately before whatever time you look at it. And the rankings can change hourly! The app also shows a scoreboard for each of the previous 7 days which is measured on a calendar-day basis.
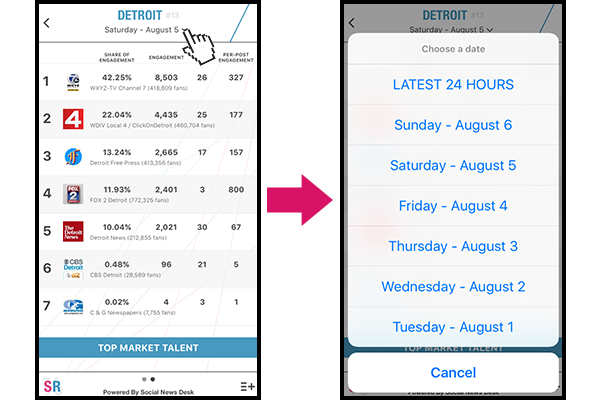
DD: And those daily scoreboards can be accessed from the time-frame menu under the DMA information at the top of the screen. One last question related to the content side of the app. If you scroll down in the app you can see the “Top Local Content”, how is that determined?
AK: “Top Local Content” is made up of any posts created by Facebook Pages that are part of the ranked scoreboard for a given market. We rank the top performing posts by total simple engagement (likes + comments + shares) and make them available within the Social Rankings app so you can see what is working in your market.
DD: That’s great, thank you so much!
If you haven’t downloaded it yet, or want to learn more, check out this article about the app: Free Social Rankings App for Local News.
If you have any questions about this app or your social strategy, we want to help! You can email us at support@socialnewsdesk.com with any questions or feedback you have. Additionally, our Client Services team can put together a Custom Webinar for you today and help get your team on the same page leading up to the November book.